Physician Service Details section
The Physician Service Details section helps hospitals analyze physician resource use individually or in groups. The parameters provide a number of ways to compare the selected physician(s) against customizable internal benchmark groups. This tool can be accessed in scorecards by adding the Physician Service Details section to any scorecard.
Work with data
See the following Physician Service Details menu. To set the data parameters, change the information in each white box with a pencil icon.

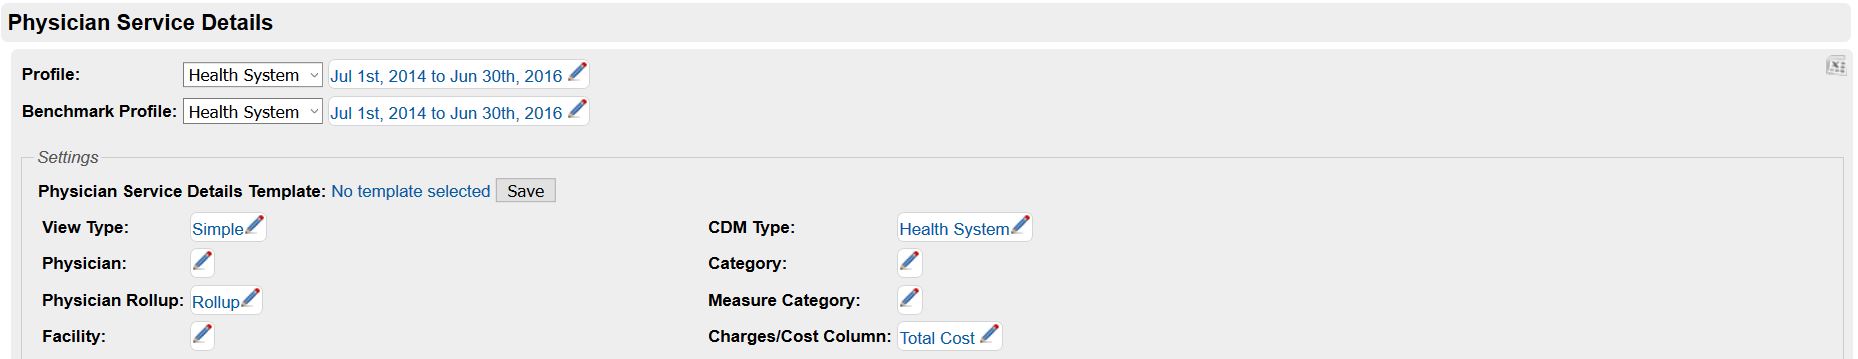
When you change any of the section parameter settings, a red box appears below the menu. Click the Rerun button to run the data search again, recalculating the results according to the options you chose.
In the top right corner of the Settings box is a green Excel icon. Click the icon to download and save the data in an Excel spreadsheet.

| Parameter | Function |
|---|---|
| Profile | Use the dropdown to select one of the internal profiles you've created on this Scorecard. You can also select the time period of interest for this analysis to narrow your patient population. |
| Benchmark Profile |
Use the dropdown to select a comparison profile from the internal profiles you've created on this Scorecard; also select the time period for comparison. For example, you might analyze the same patient population during two different time frames (this quarter versus last quarter) or two different populations during the same time frame (Dr. A's patients versus Dr. B's patients). |
| View Type | Select if you would like the Simple or Detailed view. The Detailed view includes 5 additional columns (see the table below for more information): Profile Volume, Benchmark Volume, Profile % of Cases Used, Benchmark % of Cases Used, Diff % of Cases Used |
| Physician |
Choose one or more physicians from the searchable list. The list can be sorted by hospital identification number, first name, last name, specialty, secondary specialty, group, primary facility, and/or active status. Filter each column using the white boxes above the column names and select physicians by checking one or more boxes in the first column. The check box at the top selects all the physicians in the list. You must choose at least one physician before running the data search. 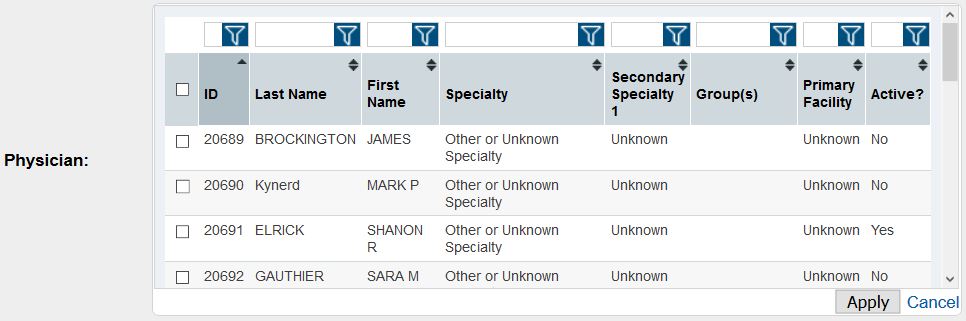
|
| Physician role |
Choose from the following physician roles:
|
| Physician rollup |
This section can roll up the data from multiple selected physicians or process it separately. If you select Rollup from the dropdown, data for all selected physicians shows as one and compare their combined data to the benchmark group. If you only select one physician, Rollup has no effect on the data. Selecting Expanded shows the physicians individually. In the table, each physician’s data is labeled with the physician's name and physician ID and is compared individually to the benchmark group. |
| Facility | If you would like to filter by facility, select one or more facilities to be included; not selecting any facilities returns data for all facilities. |
| CDM Type | Choose either Health System or Facility level CDM types. Selecting Health System includes all facilities in one row. Selecting Facility expands each CDM to multiple rows, one for each facility previously selected. |
| Category | Select one or more high-level revenue code categories; not selecting a category returns all categories. For more information, see Revenue Code categories. |
| Measure Category | Select one or more specific revenue code categories; not selecting a measure category returns all categories. These measure categories match the domains in the Charges and Costs Detail section. |
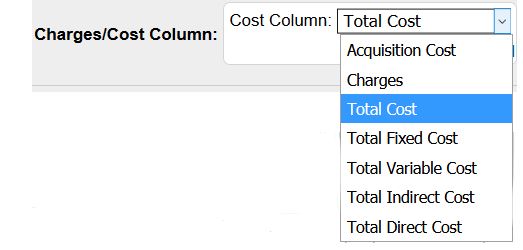
| Charges/Cost Column |
Select which values to display in the corresponding columns. Options include: Acquisition Cost, Charges, Total Cost, Total Fixed Cost, Total Variable Cost, Total Indirect Cost, and Total Direct Cost.
This selection affects five columns in the table - two in the middle of the table and the last three columns on the right side. The table below explains how the columns change and what they mean. |
Understand the data table
The following is a sample data table of the Detailed view; note that the Simple view has five fewer columns, but the remaining column values do not change.
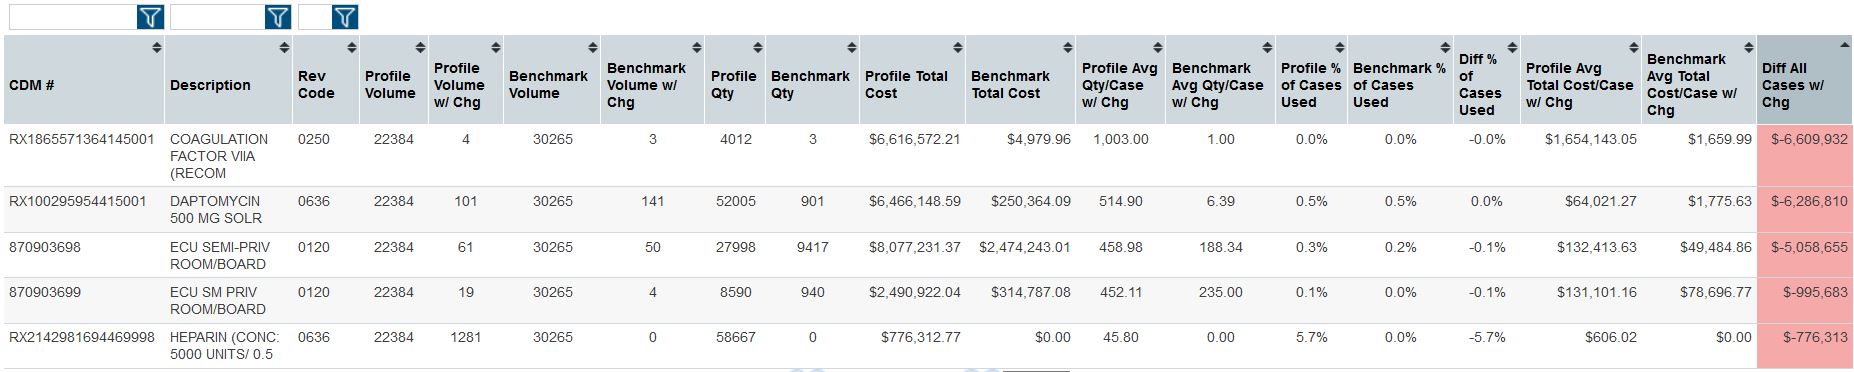
Enter content in the white boxes above the columns to search in that column, or click the small black arrows next to the column name to sort the values with either the highest or lowest value at the top. The Description column sorts alphabetically.
The available columns in the data table follow. Note that if the Physician Rollup option is "Expanded," the rows are Physician-level and the column headers are similar to those that follow, but with "Physician" in place of "Profile."
| Column | Description | |
|---|---|---|
| Facility ID | If you selected the CDM Type - Facility option, this column shows the ID number of the facility associated with the specific CDM #. | |
| CDM # (Charge Description Master Number) | A hospital-specific identification number for the charge description | |
| Description | Hospital-specific name for the charge | |
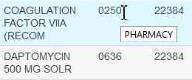
| Rev (Revenue) Code |
An industry-standard grouping for charges. If you hover over a revenue code in the table, a box appears identifying what the specific revenue code means.
|
|
| Physician | If you selected the Physician Rollup – Expanded option, this column shows the name and ID number of the physician associated with the encounter. Also note that the columns that follow are labeled as "Physician" instead of "Profile" to indicate this change. | |
| Profile Volume | Number of encounters in the selected Profile | |
| Profile Volume w/Chg (with Charge) | Number of encounters in the selected Profile with that charge | |
| Benchmark Volume | Number of encounters in the selected Benchmark Profile | |
| Benchmark Volume w/Chg (with Charge) | Number of encounters in the selected Benchmark Profile with that charge | |
| Profile Qty (Quantity) | Total quantity charged for the selected profile or physician(s) for that charge item. Counts multiple days of room and board, multiple administrations of medications, and so on. | |
| Benchmark Qty | Total quantity charged for the selected benchmark profile for that charge item. Counts multiple days of room and board, multiple administrations of medications, and so on. | |
| The next two columns depend on what you selected for the Charges/Cost column in the top menu. | ||
| If you select Acquisition Cost: | Profile Acquisition Cost | Total Acquisition Cost for all cases associated with the selected Profile |
| Benchmark Acquisition Cost | Total acquisition cost for all cases associated with the selected Benchmark Profile | |
| If you select Charges: | Profile Charge Amount | Total charge for all cases associated with the selected Profile |
| Benchmark Charge Amount | Total charge for all cases associated with the Benchmark Profile | |
| If you select Total Cost: | Profile Total Cost | Total cost for all cases associated with the selected Profile |
| Benchmark Total Cost | Total cost for all cases associated with the Benchmark Profile | |
| If you select Total Fixed Cost: | Profile Total Fixed Cost | Total fixed cost for all cases associated with the selected Profile |
| Benchmark Total Fixed Cost | Total fixed cost for all cases associated with the Benchmark Profile | |
| If you select Total Variable Cost: | Profile Total Variable Cost | Total variable cost for all cases associated with the selected Profile |
| Benchmark Total Variable Cost | Total variable cost for all cases associated with the Benchmark Profile | |
| If you select Total Indirect Cost: | Profile Total Indirect Cost | Total indirect cost for all cases associated with the selected Profile |
| Benchmark Total Indirect Cost | Total indirect cost for all cases associated with the Benchmark Profile | |
| If you selected Total Direct Cost: | Profile Total Direct Cost | Total direct cost for all cases associated with the selected Profile |
| Benchmark Total Direct Cost | Total direct cost for all cases associated with the Benchmark Profile | |
| Profile Avg Qty/Case w/Chg (Average Quantity per Case with Charge) | Quantity divided by the number of cases for the selected Profile | |
| Benchmark Avg Qty/Case w/Chg (Average Quantity per Case with Charge) | Benchmark profile quantity divided by the number of benchmark cases with charge | |
| Profile % (Percent) of Cases Used | Number of cases with charges divided by the number of cases for the selected Profile | |
| Benchmark % of Cases Used | Number of benchmark cases with charges divided by the number of cases for the selected Benchmark Profile | |
| Diff (Difference in) % of Cases Used | Difference between the Profile and Benchmark Profile percent of cases used | |
| The last three columns depend on what you selected for the Charges/Cost column in the top menu. | ||
| If you select Acquisition Cost: | Profile Avg Acquisition Cost/Case w/ Chg | Total acquisition cost divided by number of cases for the selected Profile |
| Benchmark Avg Acquisition Cost/Case w/ Chg | Benchmark total acquisition cost divided by number of cases in the selected Benchmark Profile | |
| Diff All Cases w/ Chg | Difference between the Profile and Benchmark Profile average acquisition cost per case, multiplied by the number of Profile cases and rounded to the nearest dollar | |
| If you select Charges: | Profile Avg Charge Amount/Case w/ Chg | Total charge amount divided by number of cases for the selected Profile |
| Benchmark Avg Charge Amount/Case w/ Chg | Benchmark total charge amount divided by number of cases in the selected Benchmark Profile | |
| Diff All Cases w/ Chg | Difference between the Profile and Benchmark Profile average charge amount per case, multiplied by the number of Profile cases and rounded to the nearest dollar | |
| If you select Total Cost: | Profile Avg Total Cost/Case w/ Chg | Total cost divided by number of cases for the selected Profile |
| Benchmark Avg Total Cost/Case w/ Chg | Benchmark total cost divided by number of cases in the selected Benchmark Profile | |
| Diff All Cases w/ Chg | Difference between the Profile and Benchmark Profile average total cost per case, multiplied by the number of Profile cases and rounded to the nearest dollar | |
| If you select Total Fixed Cost: | Profile Avg Total Fixed Cost/Case w/ Chg | Total fixed cost divided by number of cases for the selected Profile |
| Benchmark Avg Total Fixed Cost/Case w/ Chg | Benchmark total fixed cost divided by number of cases in the selected Benchmark Profile | |
| Diff All Cases w/ Chg | Difference between the Profile and Benchmark Profile average total fixed cost per case, multiplied by the number of Profile cases and rounded to the nearest dollar | |
| If you select Total Variable Cost: | Profile Avg Total Variable Cost/Case w/ Chg | Total variable cost divided by number of cases for the selected Profile |
| Benchmark Avg Total Variable Cost/Case w/ Chg | Benchmark total variable cost divided by number of cases in the selected Benchmark Profile | |
| Diff All Cases w/ Chg | Difference between the Profile and Benchmark Profile average total variable cost per case, multiplied by the number of Profile cases and rounded to the nearest dollar | |
| If you select Total Indirect Cost: | Profile Avg Total Indirect Cost/Case w/ Chg | Total indirect cost divided by number of cases for the selected Profile |
| Benchmark Avg Total Indirect Cost/Case w/ Chg | Benchmark total indirect cost divided by number of cases in the selected Benchmark Profile | |
| Diff All Cases w/ Chg | Difference between the Profile and Benchmark Profile average total indirect cost per case, multiplied by the number of Profile cases and rounded to the nearest dollar | |
| If you select Total Direct Cost: | Profile Avg Total Direct Cost/Case w/ Chg | Total direct cost divided by number of cases for the selected Profile |
| Benchmark Avg Total Direct Cost/Case w/ Chg | Benchmark total direct cost divided by number of cases in the selected Benchmark Profile | |
| Diff All Cases w/ Chg | Difference between the Profile and Benchmark Profile average total direct cost per case, multiplied by the number of Profile cases and rounded to the nearest dollar | |